New Printable Worksheets and Lesson Activities. Page 6
English Language Arts
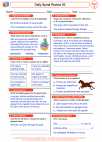
ELA Daily Spiral Review (5th Grade) provides short, daily practice activities that revisit and strengthen key language arts skills. Each day’s work is designed to take 5–10 minutes and includes a mix of topics students have already learned, so they keep practicing while moving forward.

ELA Daily Spiral Review (5th Grade) provides short, daily practice activities that revisit and strengthen key language arts skills. Each day’s work is designed to take 5–10 minutes and includes a mix of topics students have already learned, so they keep practicing while moving forward.
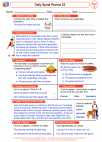
ELA Daily Spiral Review (5th Grade) provides short, daily practice activities that revisit and strengthen key language arts skills. Each day’s work is designed to take 5–10 minutes and includes a mix of topics students have already learned, so they keep practicing while moving forward.

ELA Daily Spiral Review (5th Grade) provides short, daily practice activities that revisit and strengthen key language arts skills. Each day’s work is designed to take 5–10 minutes and includes a mix of topics students have already learned, so they keep practicing while moving forward.

ELA Daily Spiral Review (5th Grade) provides short, daily practice activities that revisit and strengthen key language arts skills. Each day’s work is designed to take 5–10 minutes and includes a mix of topics students have already learned, so they keep practicing while moving forward.
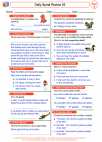
ELA Daily Spiral Review (5th Grade) provides short, daily practice activities that revisit and strengthen key language arts skills. Each day’s work is designed to take 5–10 minutes and includes a mix of topics students have already learned, so they keep practicing while moving forward.
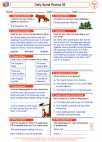
ELA Daily Spiral Review (5th Grade) provides short, daily practice activities that revisit and strengthen key language arts skills. Each day’s work is designed to take 5–10 minutes and includes a mix of topics students have already learned, so they keep practicing while moving forward.
ELA Daily Spiral Review (5th Grade) provides short, daily practice activities that revisit and strengthen key language arts skills. Each day’s work is designed to take 5–10 minutes and includes a mix of topics students have already learned, so they keep practicing while moving forward.
ELA Daily Spiral Review (5th Grade) provides short, daily practice activities that revisit and strengthen key language arts skills. Each day’s work is designed to take 5–10 minutes and includes a mix of topics students have already learned, so they keep practicing while moving forward.
ELA Daily Spiral Review (5th Grade) provides short, daily practice activities that revisit and strengthen key language arts skills. Each day’s work is designed to take 5–10 minutes and includes a mix of topics students have already learned, so they keep practicing while moving forward.
ELA Daily Spiral Review (5th Grade) provides short, daily practice activities that revisit and strengthen key language arts skills. Each day’s work is designed to take 5–10 minutes and includes a mix of topics students have already learned, so they keep practicing while moving forward.
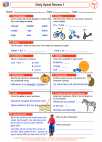
ELA Daily Spiral Review (2nd Grade) provides short, daily practice activities that revisit and strengthen key language arts skills. Each day’s work is designed to take 5–10 minutes and includes a mix of topics students have already learned, so they keep practicing while moving forward.

ELA Daily Spiral Review (2nd Grade) provides short, daily practice activities that revisit and strengthen key language arts skills. Each day’s work is designed to take 5–10 minutes and includes a mix of topics students have already learned, so they keep practicing while moving forward.

ELA Daily Spiral Review (2nd Grade) provides short, daily practice activities that revisit and strengthen key language arts skills. Each day’s work is designed to take 5–10 minutes and includes a mix of topics students have already learned, so they keep practicing while moving forward.

ELA Daily Spiral Review (2nd Grade) provides short, daily practice activities that revisit and strengthen key language arts skills. Each day’s work is designed to take 5–10 minutes and includes a mix of topics students have already learned, so they keep practicing while moving forward.
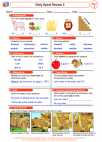
ELA Daily Spiral Review (2nd Grade) provides short, daily practice activities that revisit and strengthen key language arts skills. Each day’s work is designed to take 5–10 minutes and includes a mix of topics students have already learned, so they keep practicing while moving forward.

ELA Daily Spiral Review (2nd Grade) provides short, daily practice activities that revisit and strengthen key language arts skills. Each day’s work is designed to take 5–10 minutes and includes a mix of topics students have already learned, so they keep practicing while moving forward.

ELA Daily Spiral Review (2nd Grade) provides short, daily practice activities that revisit and strengthen key language arts skills. Each day’s work is designed to take 5–10 minutes and includes a mix of topics students have already learned, so they keep practicing while moving forward.

ELA Daily Spiral Review (2nd Grade) provides short, daily practice activities that revisit and strengthen key language arts skills. Each day’s work is designed to take 5–10 minutes and includes a mix of topics students have already learned, so they keep practicing while moving forward.

ELA Daily Spiral Review (2nd Grade) provides short, daily practice activities that revisit and strengthen key language arts skills. Each day’s work is designed to take 5–10 minutes and includes a mix of topics students have already learned, so they keep practicing while moving forward.