What is a Graph?
A graph is a visual representation of data that shows the relationship between different sets of information. It consists of two axes - the horizontal x-axis and the vertical y-axis. The point where the axes intersect is called the origin.
Types of Graphs
There are several types of graphs, including:
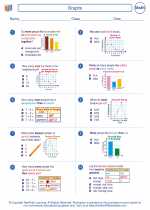
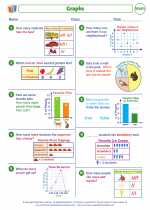
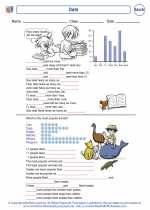
- Bar Graph: A graph that uses bars to represent and compare different categories of data.
- Line Graph: A graph that uses points connected by lines to show how data changes over time or in relation to one another.
- Pie Chart: A circular graph that is divided into slices to show the proportion of each category in the whole data set.
- Scatter Plot: A graph that uses points to represent the relationship between two sets of data.
Reading and Interpreting Graphs
When reading a graph, it's important to understand the key components, such as the title, labels for the x and y-axes, and the scale. By analyzing the graph, you can draw conclusions about the data, identify trends, and make predictions.
Creating a Graph
To create a graph, you need to organize your data and choose the most appropriate type of graph to represent it. Then, plot the data points on the graph and label the axes to provide context and clarity.
Uses of Graphs
Graphs are used in various fields such as mathematics, science, economics, and social sciences to visually represent and analyze data. They help in making comparisons, identifying patterns, and communicating information effectively.
[Graphs] Related Worksheets and Study Guides:
.◂Math Worksheets and Study Guides Second Grade. Graphs
 Worksheet/Answer key
 Worksheet/Answer key
 Worksheet/Answer key
 Worksheet/Answer key
 Worksheet/Answer key
 Worksheet/Answer key
 Worksheet/Answer key
 Worksheet/Answer key
 Worksheet/Answer key