Graphs
A graph is a visual representation of data that shows the relationship between different variables. Graphs are used to organize and interpret data, making it easier to understand and analyze complex information.
Types of Graphs
There are several types of graphs commonly used to represent data:
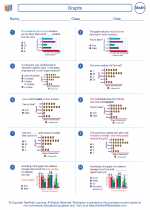
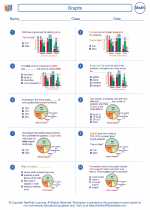
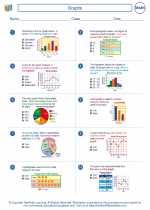
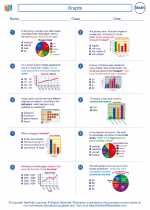
- Bar Graphs: These are used to compare different categories of data. The height of each bar represents the frequency or amount of each category.
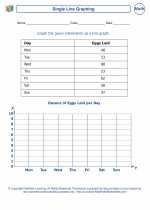
- Line Graphs: These are used to show the change in data over time. They are especially useful for displaying trends and patterns.
- Pie Charts: These are circular graphs that show the composition of a whole. Each "slice" of the pie represents a proportion of the whole.
- Scatter Plots: These are used to display the relationship between two variables. Each point on the graph represents a pair of values for the two variables.
Key Concepts
When working with graphs, it's important to understand the following key concepts:
- Axis: The horizontal and vertical lines on a graph, used to plot and measure data.
- Scale: The units and intervals used on the axes to represent data accurately.
- Title: A brief description of the graph's content, usually located at the top.
- Labels: Descriptive text used to identify the different parts of the graph, such as categories or data points.
- Legend: A key that explains the meaning of different colors or symbols used in the graph.
Graphing Software
There are many software tools available for creating and analyzing graphs, including Microsoft Excel, Google Sheets, and Graphing Calculator. These tools provide a wide range of options for customizing and formatting graphs to best represent the data.
Practice Problems
1. Create a bar graph to show the sales of different products in a store over the past year.
2. Use a line graph to display the temperature changes in a city over the course of a week.
3. Make a pie chart to illustrate the distribution of students' favorite subjects in a school.
4. Create a scatter plot to analyze the relationship between hours of study and test scores for a group of students.
By understanding the different types of graphs, key concepts, and practice problems, you will be well-prepared to work with and interpret various types of data using graphs.
[Graphs] Related Worksheets and Study Guides:
.◂Math Worksheets and Study Guides Sixth Grade. Graphs
 Activity Lesson
 Worksheet/Answer key
 Worksheet/Answer key
 Worksheet/Answer key
 Worksheet/Answer key
 Worksheet/Answer key
 Worksheet/Answer key
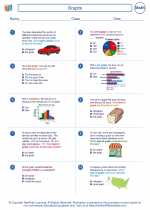
 Worksheet/Answer key
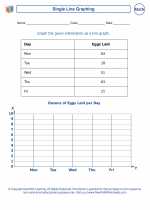
 Worksheet/Answer key
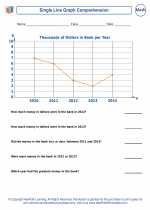
 Worksheet/Answer key
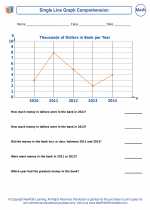
 Worksheet/Answer key
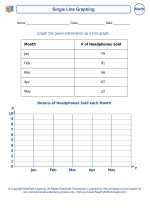
 Worksheet/Answer key
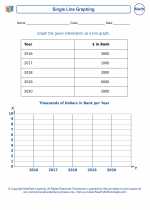
 Worksheet/Answer key
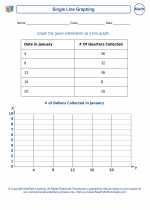
 Worksheet/Answer key
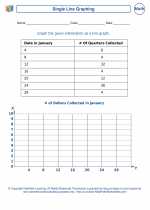
 Worksheet/Answer key
 Worksheet/Answer key